To open long positions on EURUSD, you need:
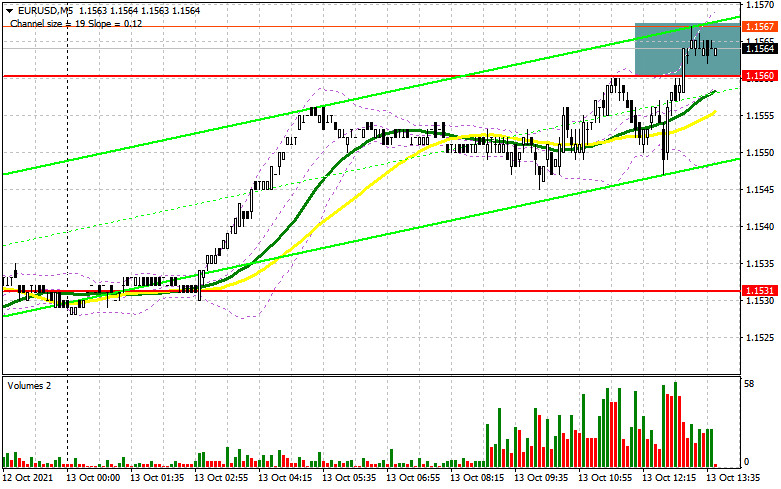
Nothing interesting happened in the morning. Given that the volatility after the major Asian growth was again fairly low, there were no signals to enter the market. The data on German inflation did not surprise anyone, as the indicator remained unchanged compared to last month, and there was no expected reaction to the report on industrial production in the eurozone. Let's look at the 5-minute chart. Now the bears are defending the resistance of 1.1560 on it, and the market's direction will depend on who will be stronger. From a technical point of view, nothing much has changed.
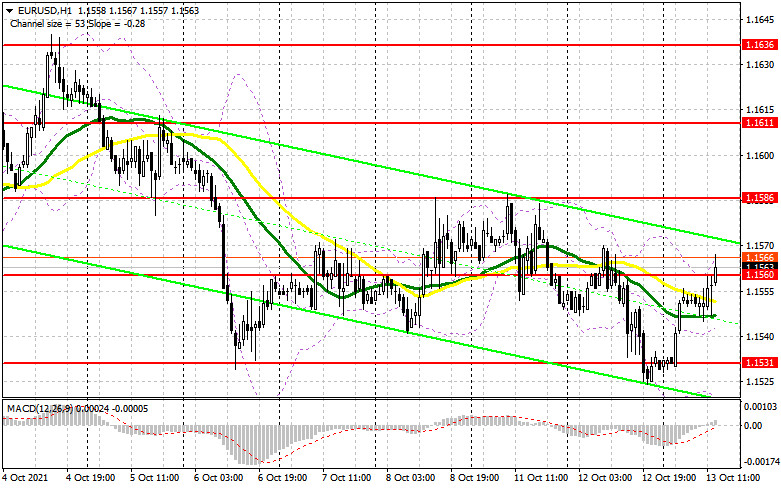
In the second half of the day, we are waiting for important fundamental data on inflation in the United States, and its larger growth may lead to a strengthening of the dollar. If the data disappoint traders, the pressure on the euro will weaken, and it will be possible to observe the upward correction of the pair. The primary task of the bulls will be a breakthrough and consolidation above the 1.1560 range, as well as its reverse test from top to bottom, which forms a signal to buy the euro in the expectation of restoring the pair to the upper boundary of the 1.1586 side channel. Only a breakdown of this range with a similar top-down test, together with a decrease in inflationary pressure in the US, will allow the bulls to build a new upward trend with the prospect of strengthening EUR/USD to the area of 1.1611, where I recommend fixing the profits. A more distant target will be a maximum of 1.1636. In the scenario of a decline in EUR/USD after publishing inflation data, it is best not to rush with long positions. The optimal scenario will be the formation of a false breakdown in the support area of 1.1531. In the absence of bull activity at this level, I advise you to postpone long positions to new lows around 1.1510 and 1.1482 - and then, counting on an upward correction of 15-20 points within the day.
To open short positions on EURUSD, you need:
Although the bears keep the market under their control, they are not in a hurry to be particularly active before publishing fundamental statistics. Strong data on the United States of America will help to continue the bearish trend for the pair. During the American session, euro sellers will target the lower border of the 1.1531 side channel. A breakout and a test of this level from the bottom up will lead to the formation of a signal to open short positions, which will quickly push EUR/USD to the next intermediate level of 1.1510. A more distant goal will be a new minimum of 1.1454, where I recommend fixing the profits. A very important task for the bears remains to protect the middle of the 1.1560 side channel, where the main trade is now conducted. As noted above, only a return to this level and consolidation form the first signal to open short positions, which will return pressure on the pair and push it to a minimum of 1.1531. In the scenario of a sharp rise in the euro in the afternoon and the absence of sellers at 1.1560, it is best to postpone sales to the upper limit of the 1.1586 side-channel or open short positions immediately for a rebound based on a downward correction of 15-20 points from a new maximum of 1.1611.
The COT report (Commitment of Traders) for October 5 recorded a sharp increase in short and only a slight increase in long positions, which reduced the net position. A large increase in short positions only confirms the formation of a bear market for the European currency. Political problems in the United States of America, some of which have already been solved at the moment, also affected the current positions of the players in the COT report under consideration. Friday's report from the US Department of Commerce on the labor market (not taken into account in this COT report) most likely will not affect the balance of power of buyers and sellers, as the data turned out to be quite ambiguous. All this only confirms the continuation of the bullish trend in the US dollar, which will be observed this week. The prospect of changes in the monetary policy of the Federal Reserve System allows traders to build up long positions on the dollar without much difficulty, as many investors expect the central bank to begin reducing the bond purchase program closer to the end of this year. Demand for risky assets will remain limited due to the wait-and-see attitude of the European Central Bank. Last week, the ECB president said that she would continue to adhere to a wait-and-see position and maintain a stimulating policy at current levels. The COT report indicates that long non-commercial positions increased from the level of 195,043 to the level of 196,819, while short non-commercial positions jumped quite seriously - from the level of 194,171 to the level of 219,153. At the end of the week, the total non-commercial net position entered the negative zone and dropped from 872 to the level of -22334. The weekly closing price also fell to 1.1616 from 1.1695.
Signals of indicators:
Moving averages
Trading is conducted around 30 and 50 daily moving averages, which indicates the lateral nature of the market and the lack of direction.
Note: The author considers the period and prices of moving averages on the hourly chart H1 and differ from the general definition of the classic daily moving averages on the daily chart D1.
Bollinger Bands
In case of a decline in the euro, the lower limit of the indicator, around 1.1520, will provide support.
Description of indicators
- Moving average (moving average determines the current trend by smoothing out volatility and noise). Period 50. The graph is marked in yellow.
- Moving average (moving average determines the current trend by smoothing out volatility and noise). Period 30. The graph is marked in green.
- MACD indicator (Moving Average Convergence / Divergence - moving average convergence/divergence) Fast EMA period 12. Slow EMA period 26. SMA period 9
- Bollinger Bands (Bollinger Bands). Period 20
- Non-profit speculative traders, such as individual traders, hedge funds, and large institutions that use the futures market for speculative purposes and meet specific requirements.
- Long non-commercial positions represent the total long open position of non-commercial traders.
- Short non-commercial positions represent the total short open position of non-commercial traders.
- Total non-commercial net position is the difference between the short and long positions of non-commercial traders.